Categories
CraftingWithData RestOfYou

Log Yourself: Breathing as the base

I am interested in learning more about how improved efforts toward monitoring and directing breathing can have a significant effect on our health and quality of life. The connections between daily stress, ample sleep, and the vagas nerve, have been first on my list of investigation. Lucid dreaming and posture are other pieces that feel related and I hope to tie in to this project. My inspiration mainly comes from regular observations and Linda Stone’s recent talk given here at ITP.

For the first assignment (”point the sensor at yourself”) in Rest of You, I have built a simple breath monitor with a stretch sensor and the Arduino. The code I’ve used so far is built on the code provided in the class blog, and I’m starting to gain familiarity with the Eclipse IDE. I’ve recorded my breathing in several scenarios and look forward to finding a clear project concept. Visualizing Data by Ben Fry is a text that has started to guide my process and the question I want to answer might go something like____. Sciencedaily.com is a resource that I am looking to for further knowledge as well.

In relation to the assignment for Crafting with Data, I re-logged data after enhancing the sensing mechanism, code, and measuring my breath while positioned horizontally in both states (resting and post-activity). The visualizations make more sense on one hand, but are completely strange on the other. I suppose this is proof that collecting good data is not a simple task.

My code and screen shots are below.

in eclipse: serialtofile and filegrapherscroll

on arduino: analogread
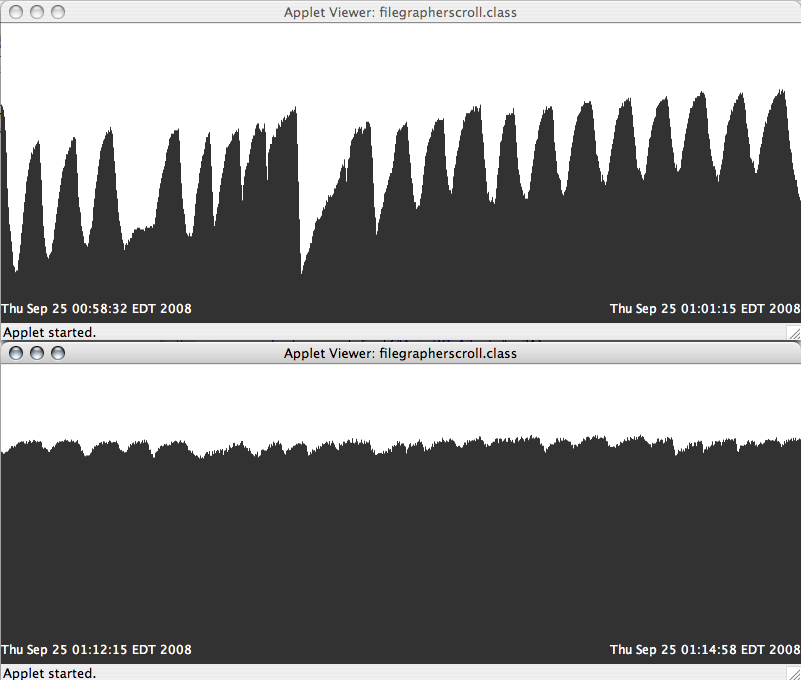
resting + activity
resting + activity
Categories
CraftingWithData

Logging data in 2 states

For the datalogging portion of this week’s assignment, Kim and I discussed using various sensors and types of visualization options. In the end, we decided to go with processing based visualization and the firmata protocol. A screen shot is above. Some data measuring breathing with a stretch sensor is stored in text files: alert + hyperalert. And the code is here.

Categories
CraftingWithData

Thinking Scientifically

The assignment for this week was to 1) log some data and 2) read the first chapter of The Canon by Natalie Angier, which is titled Thinking Scientifically. Part one seems pretty simple, and I’ve done some data logging for Rest of You this past week using a stretch sensor, which measured my breathing. However, we were encouraged to do some group work, so I plan to meet with a classmate this afternoon, possibly working with a range finder, fsr, and/or stretch sensor. It should go well. As for the reading, it’s short, so I’ve read it through a couple times. Some key ideas I’ve taken are below.

Science:

  • is not a body of facts and does not deal with absolutes
  • is about critical, hard-nosed thinking
  • is comfortable with uncertainty
  • is a state of mind in which nothing is taken at face
  • breaks problems into smaller pieces  (reductionism)
  • approaches problems from many different angles
  • is more common in everyday life than we might think
  • bypasses binaries in favor of “empirical universalism”
  • allows simple ideas to yield rich phenomena
  • is an aggressive, confrontational, and humbling process
  • demands evidence and requires new ideas to be consistent with what is already know
  • encourages us to admit mistakes, analyze misconceptions, and improve our understandings
Categories
CraftingWithData DesignForEmergingPlatforms FlashOfFlash LiveWeb RestOfYou

Integration rambling

It feels pretty good when puzzle pieces seem in place. Looking up at the full moon last night reminded me that we’re not so big and important as we tend to imagine. But of course we have significance in our environments, and we have a lot of control of what we do in and with our lives. Tis hard to keep perspective sometimes when things are extremely bad, or good. Natural reminders are nice I suppose, as long as we recognize them from time to time.

As I exited the train this morning/afternoon, it occurred to me that a pattern has begun developing with my classes this semester. The assignment for Rest of You this week is to look at myself or some sorta biorhythm (?) I produce, and try to think of or use it in a meaningful way; meanwhile, get Arduino up and running with a sensor. The one for Flash is to create an animation as an splash screen for any project using motion/shape tweens, etc. The task in Crafting with Data is to log some data using a program already provided, and like Rest of You, use the Arduino. While I was unsure if I would have the time or energy to take Flash, I now feel that taking the 2 credit course is the perfect solution to my inability to improve my Flash skills over the summer. It will motivate me and support my skillsets in other classes and beyond. My initial hesitation to buy new pComp supplies has been comforted since I’m using the items in two classes already. Also, Liveweb and Design for Emerging Platforms are going to overlap for sure, and will benefit from the Flash lessons as well. I plan to attend Red’s class tonight, as I’ve heard the speaker should be relevant to Rest of You. Hopefully it’s inspiring. Hopefully collaborative projects will begin gaining strength. Hopefully I will remember to eat well, exercise, and share myself.

Categories
CraftingWithData

Reading with skepticism

Another part of this week’s assignment is to find two articles, one that represents information well and one that doesn’t do such a great job. After being primed with Huff’s book (How to Lie With Statistics), it is almost effortless to find problems with or at least questions for virtually every article on the web. Capturing some data that doesn’t seem biased or misrepresented in some way seems impossible.

Economist (deceiving) – While the data is interesting in this article, we don’t know who the actual author is, and the chart both focuses imagery and fails to specify the type of average mentioned.

Webmonkey (a little better) – This article is extremely brief, but it does give us the name of the author and some relatively close estimates of  the number of APIs offered and API keys issued.

Bloomberg (not bad) – There is a lot of data here with many source details and actual numbers (versus vague percentages) provided.

Categories
CraftingWithData

Damned Lies

Darrell Huff’s illustrated booklet is an oldie, but definitely a worthwhile read for anyone, especially since we’re living in the age of information. The text is comical, yet presents serious advice on having a critical eye towards the info we read and see. While each chapter runs through examples to reveal numerous points, including the importance of the different versions of the term average (mean, media, mode), sample size and quality, visual tricks, etc., the final chapter ties his message together with five basic questions to ask oneself: Who says so? How does he know? What’s missing? Did somebody change the subject? Does it make sense? What’s truly unsettling is that Huff has led me to a recent study done at Princeton University, and the average American watches 25.8 hours of television per week, and only 35.4% of what is aired on news channels is true.

How To Lie With Statistics by Darrell Huff [ $ ]